The World Report on Disability estimates that 15 percent of the world population are people with disabilities. There may be some variance from one country to another. But experts believe that many countries significantly underestimate the actual prevalence rate.
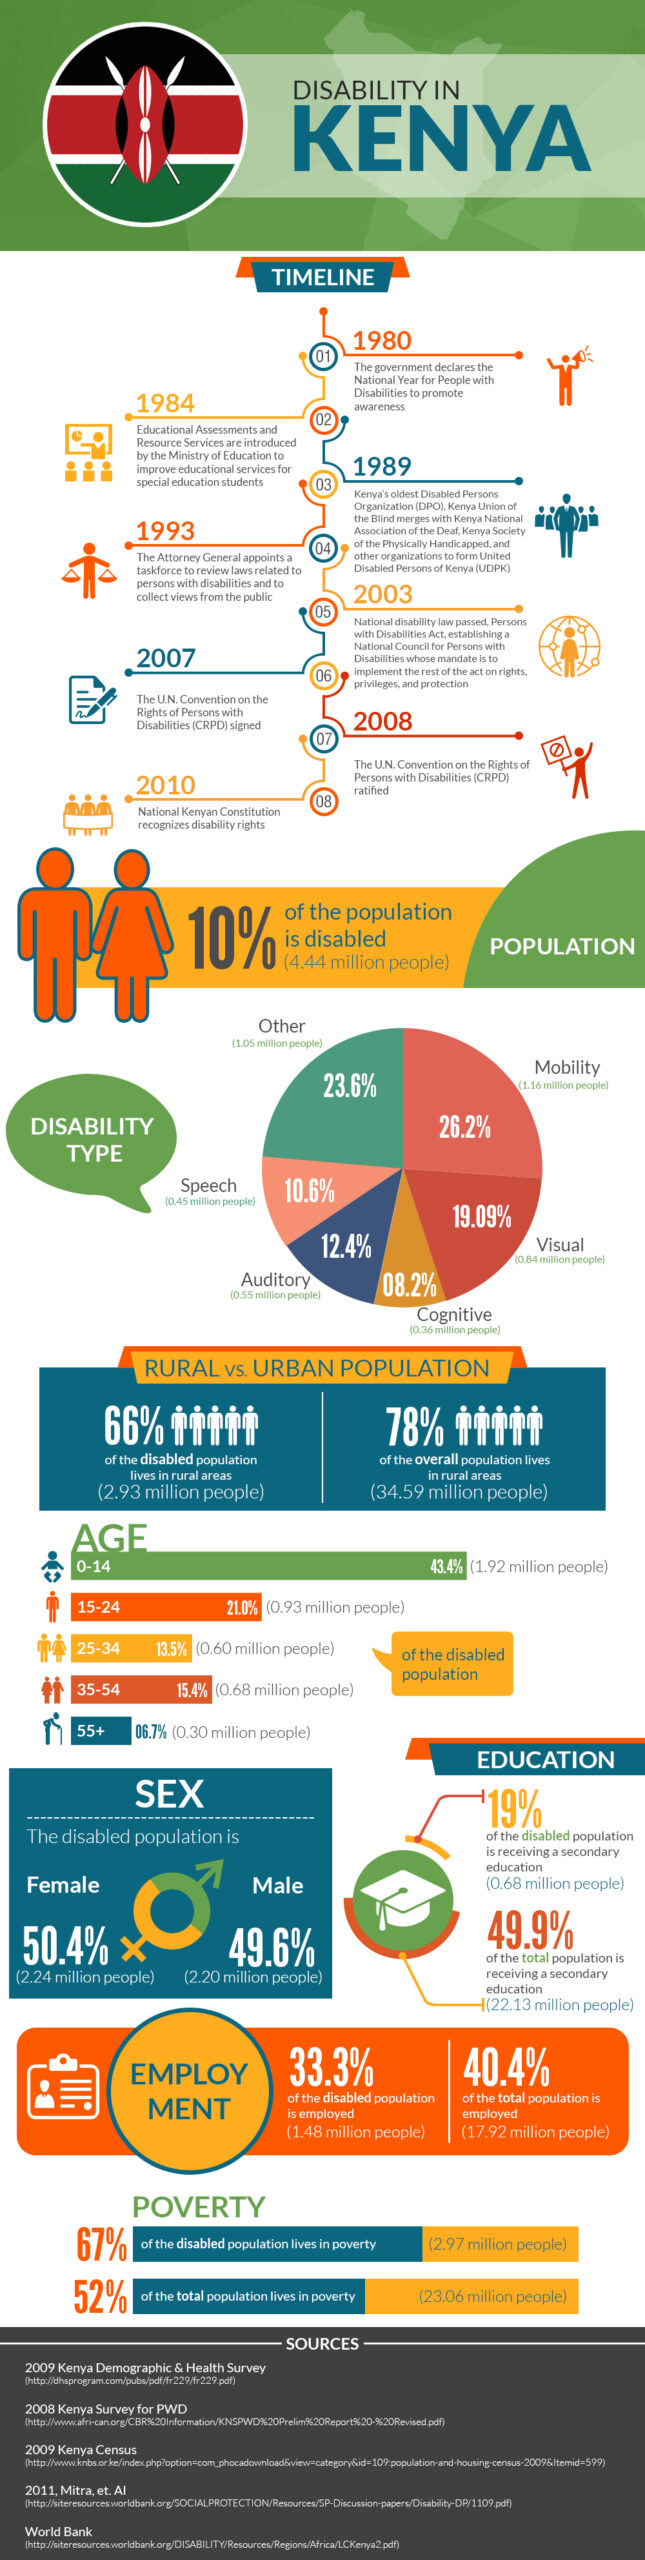
Disability in Kenya.
The center of the Kenyan flag is displayed, which includes two spears crossed behind a tall shield. The country outline of Kenya is shown in the background.
Timeline.
A cascading timeline reads:
1980 the government declares the National Year for People with Disabilities to promote awareness.
1984 Educational Assessments and Resource Services are introduced by the ministry of Education to improve educational service for special education students.
1989 Kenya’s oldest Disabled Person’s Organization (DPO), Kenya Union of the Blind mergers with Kenya National Association of the Deaf, Kenya Society of the Physically Handicapped, and other organizations to form United Disabled Persons of Kenya (UDPK).
1993 The Attorney General appoints a task force to review laws related to persons with disabilities and to collect views from the public.
2003 National disability law passed, Persons with Disabilities Act, establishing a National Council for Persons with Disabilities whose mandate is to implement the rest of the act on rights, privileges, and protection.
2007 The U.N. Convention on the Rights of Persons with Disabilities (CRPD) signed.
2008 The U.N. Convention on the Rights of Persons with Disabilities (CRPD) ratified.
2010 National Kenyan Constitution recognizes disability rights.
Population.
10% of the population is disabled (4.44 million people).
Disability Type.
A pie chart displays percentages of disability types represented in the disabled population.
Mobility 26.2% (1.16 million people).
Other 23.6% (1.05 million people).
Visual 19.09% (.84 million people).
Auditory 12.4% (.55 million people).
Speech 10.6% (.45 million people).
Cognitive 8.2% (.36 million people).
Rural vs. Urban Population.
66% of the disabled population lives in rural areas (2.93 million people).
78% of the overall population lives in rural areas (34.59 million people).
Age.
A bar graph shows age group percentages of the disabled population:
Age 0 – 14 is 43.4% (1.92 million people).
Age 15 – 24 is 21% (.93 million people).
Age 25 – 34 is 13.5% (.68 million people).
Age 35 – 54 is 15.4% (.68 million people).
Age 55 plus is 6.7% (.30 million people).
Sex.
The disabled is population is:
50.4% female (2.24 million people).
49.6% male (2.20 million people).
Education.
19% of the disabled population is receiving a secondary education (.68 million people).
49.9% of the total population is receiving a secondary education (22.13 million people).
Employment.
33.3% of the disabled population is employed (1.48 million people).
40.4% of the total population is employed (17.92 million people).
Poverty.
67% of the disabled population lives in poverty (2.97 million people).
52% of the total population lives in poverty (23.06 million people).
Sources.
2009 Kenya Demographic & Health Survey, http://dhsprogram.com/pubs/pdf/fr229/fr229.pdf.
2008 Kenya Survey for PWD, http://www.afri-can.org/CBR%20Information/KNSPWD%20Relim%20Report%20-%20Revised.pdf.
2009 Kenya Census, http://knbs.or.ke/index.php?option=com_phocadownload&view=category&id=109:population-and-housing-census-2009&Itemid=599.
2011 Mitra, Et. Al, http://siteresources.worldbank.org/SOCIALPROTECTION/Resources/SP-Discussion-papers/Disability-DP1109.pdf.
World Bank, http://siteresources.worldbank.org/DISABILITY/Resources/Regions/Africa/LCKenya2.pdf.